 |
Integrated Sustainability Analysis |
 |
| Home Contact Search Media |
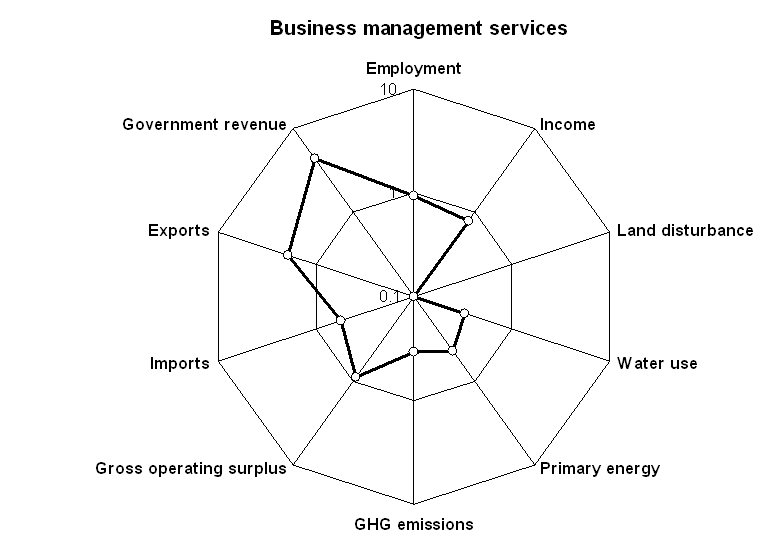
Integrated and consistent TBL ReportingThe TBL framework of the ISA / CSIRO team comprises a large range of environmental, social and economic indicators. A convenient visualisation of all TBL multipliers is a spider diagram (see figure for the example of the impact of the Australian business management services sector in terms of 10 TBL indicators). The bold line with circles depicts the total (direct and upstream) TBL impacts of the sector. The lighter line in the centre (labeled "1") represents the economy-wide averages for the TBL impacts of all sectors. Positions inside the economy-wide average represent a better than average performance against the associated indicator and positions outside the centre line are worse than average. In order to be consistent, all indicators are evaluated in an integrated way, using the same method, and covering the entire upstream supply chain (see the boundary problem). Many more indicators can be incorporated into a spider diagram. Note that better performance for some indicators implies a reduction in the magnitude of the indicators' value (specifically land disturbance, water use, primary energy, greenhouse gas emissions, and imports), and an increase in the magnitude for other indicators (employment, income, gross operating surplus, exports and government revenue). The energy performance of the business management sector, for example, is better at lower energy consumption than the economy-wide average, while income generated by the sector is slightly better than average at higher earnings.
The Australian business management sector includes a range of professions and in financial terms is dominated by legal services (24%) followed by business management (22%), accounting (18%) and advertising (10%). The integrated overview provided by the spider diagram shows a typical service sector with excellent outcomes for all indicators with the exception of government revenue and exports. The social indicators of employment generation and income are both greater than economy-wide average while all environmental indicators show good outcomes. For further information please contact
|
